september 22, 2026: regression to the mean
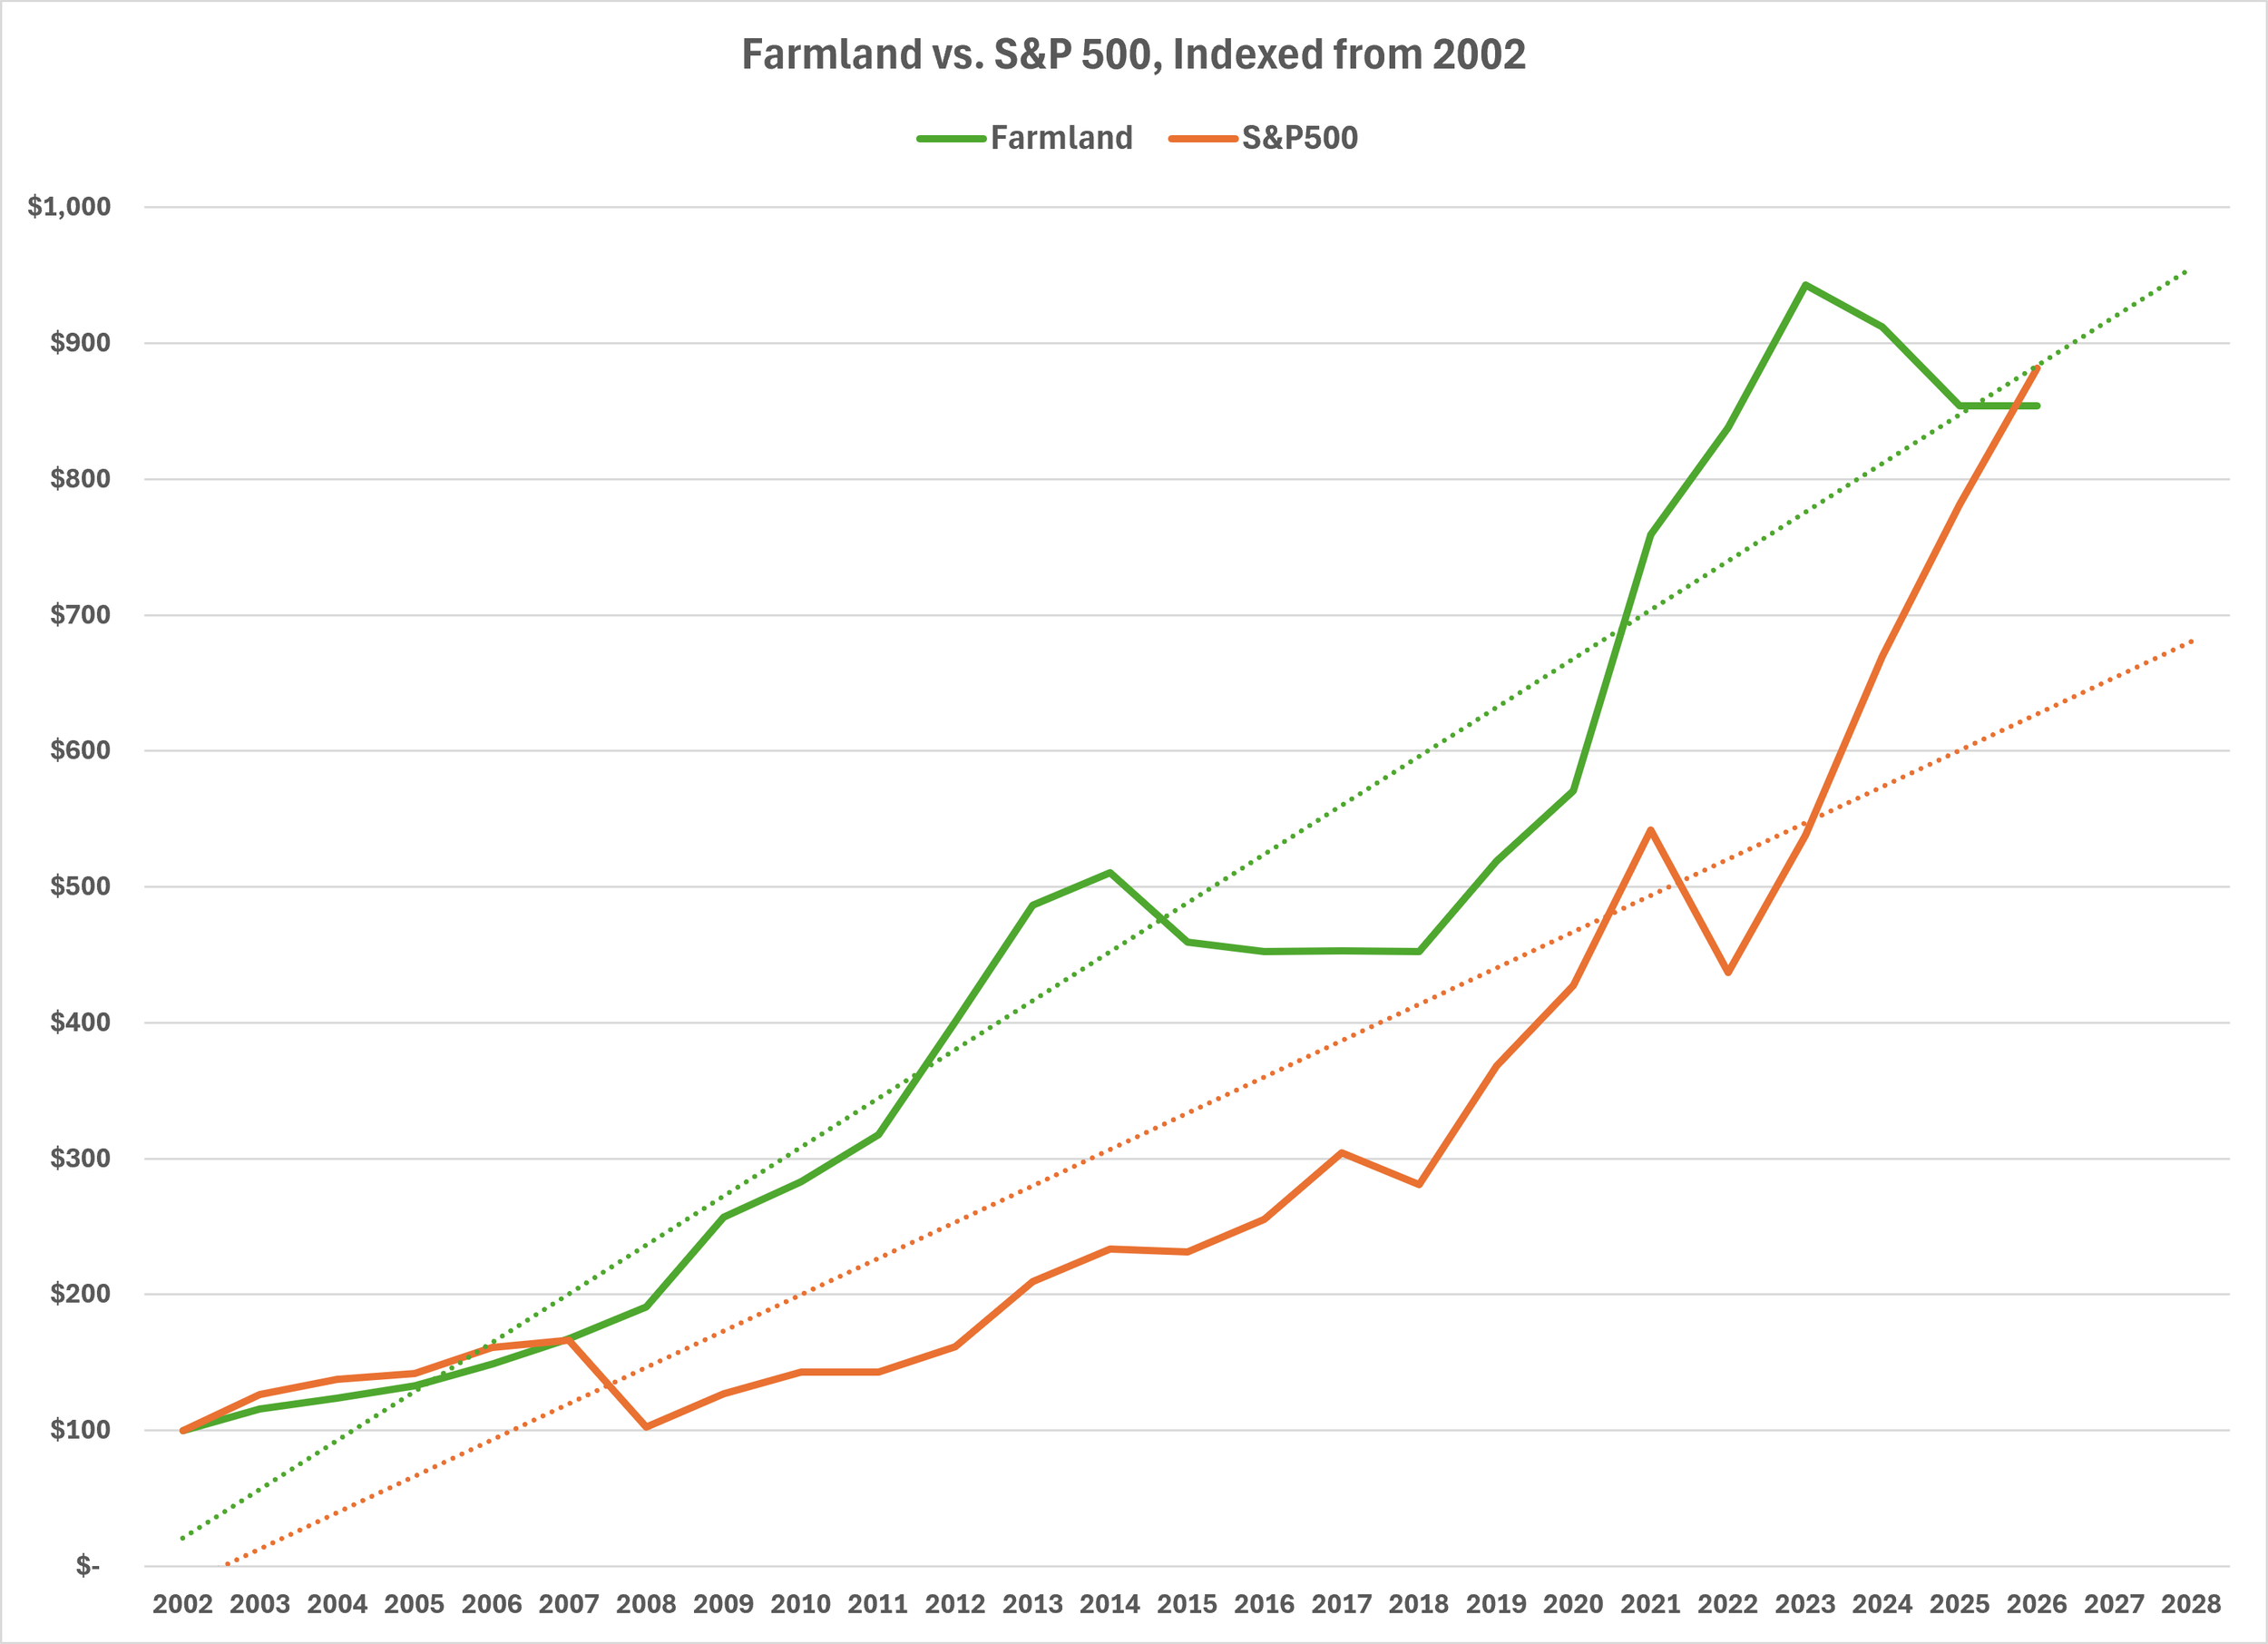
In all markets there is a tendency for prices to regress to their historic trendline
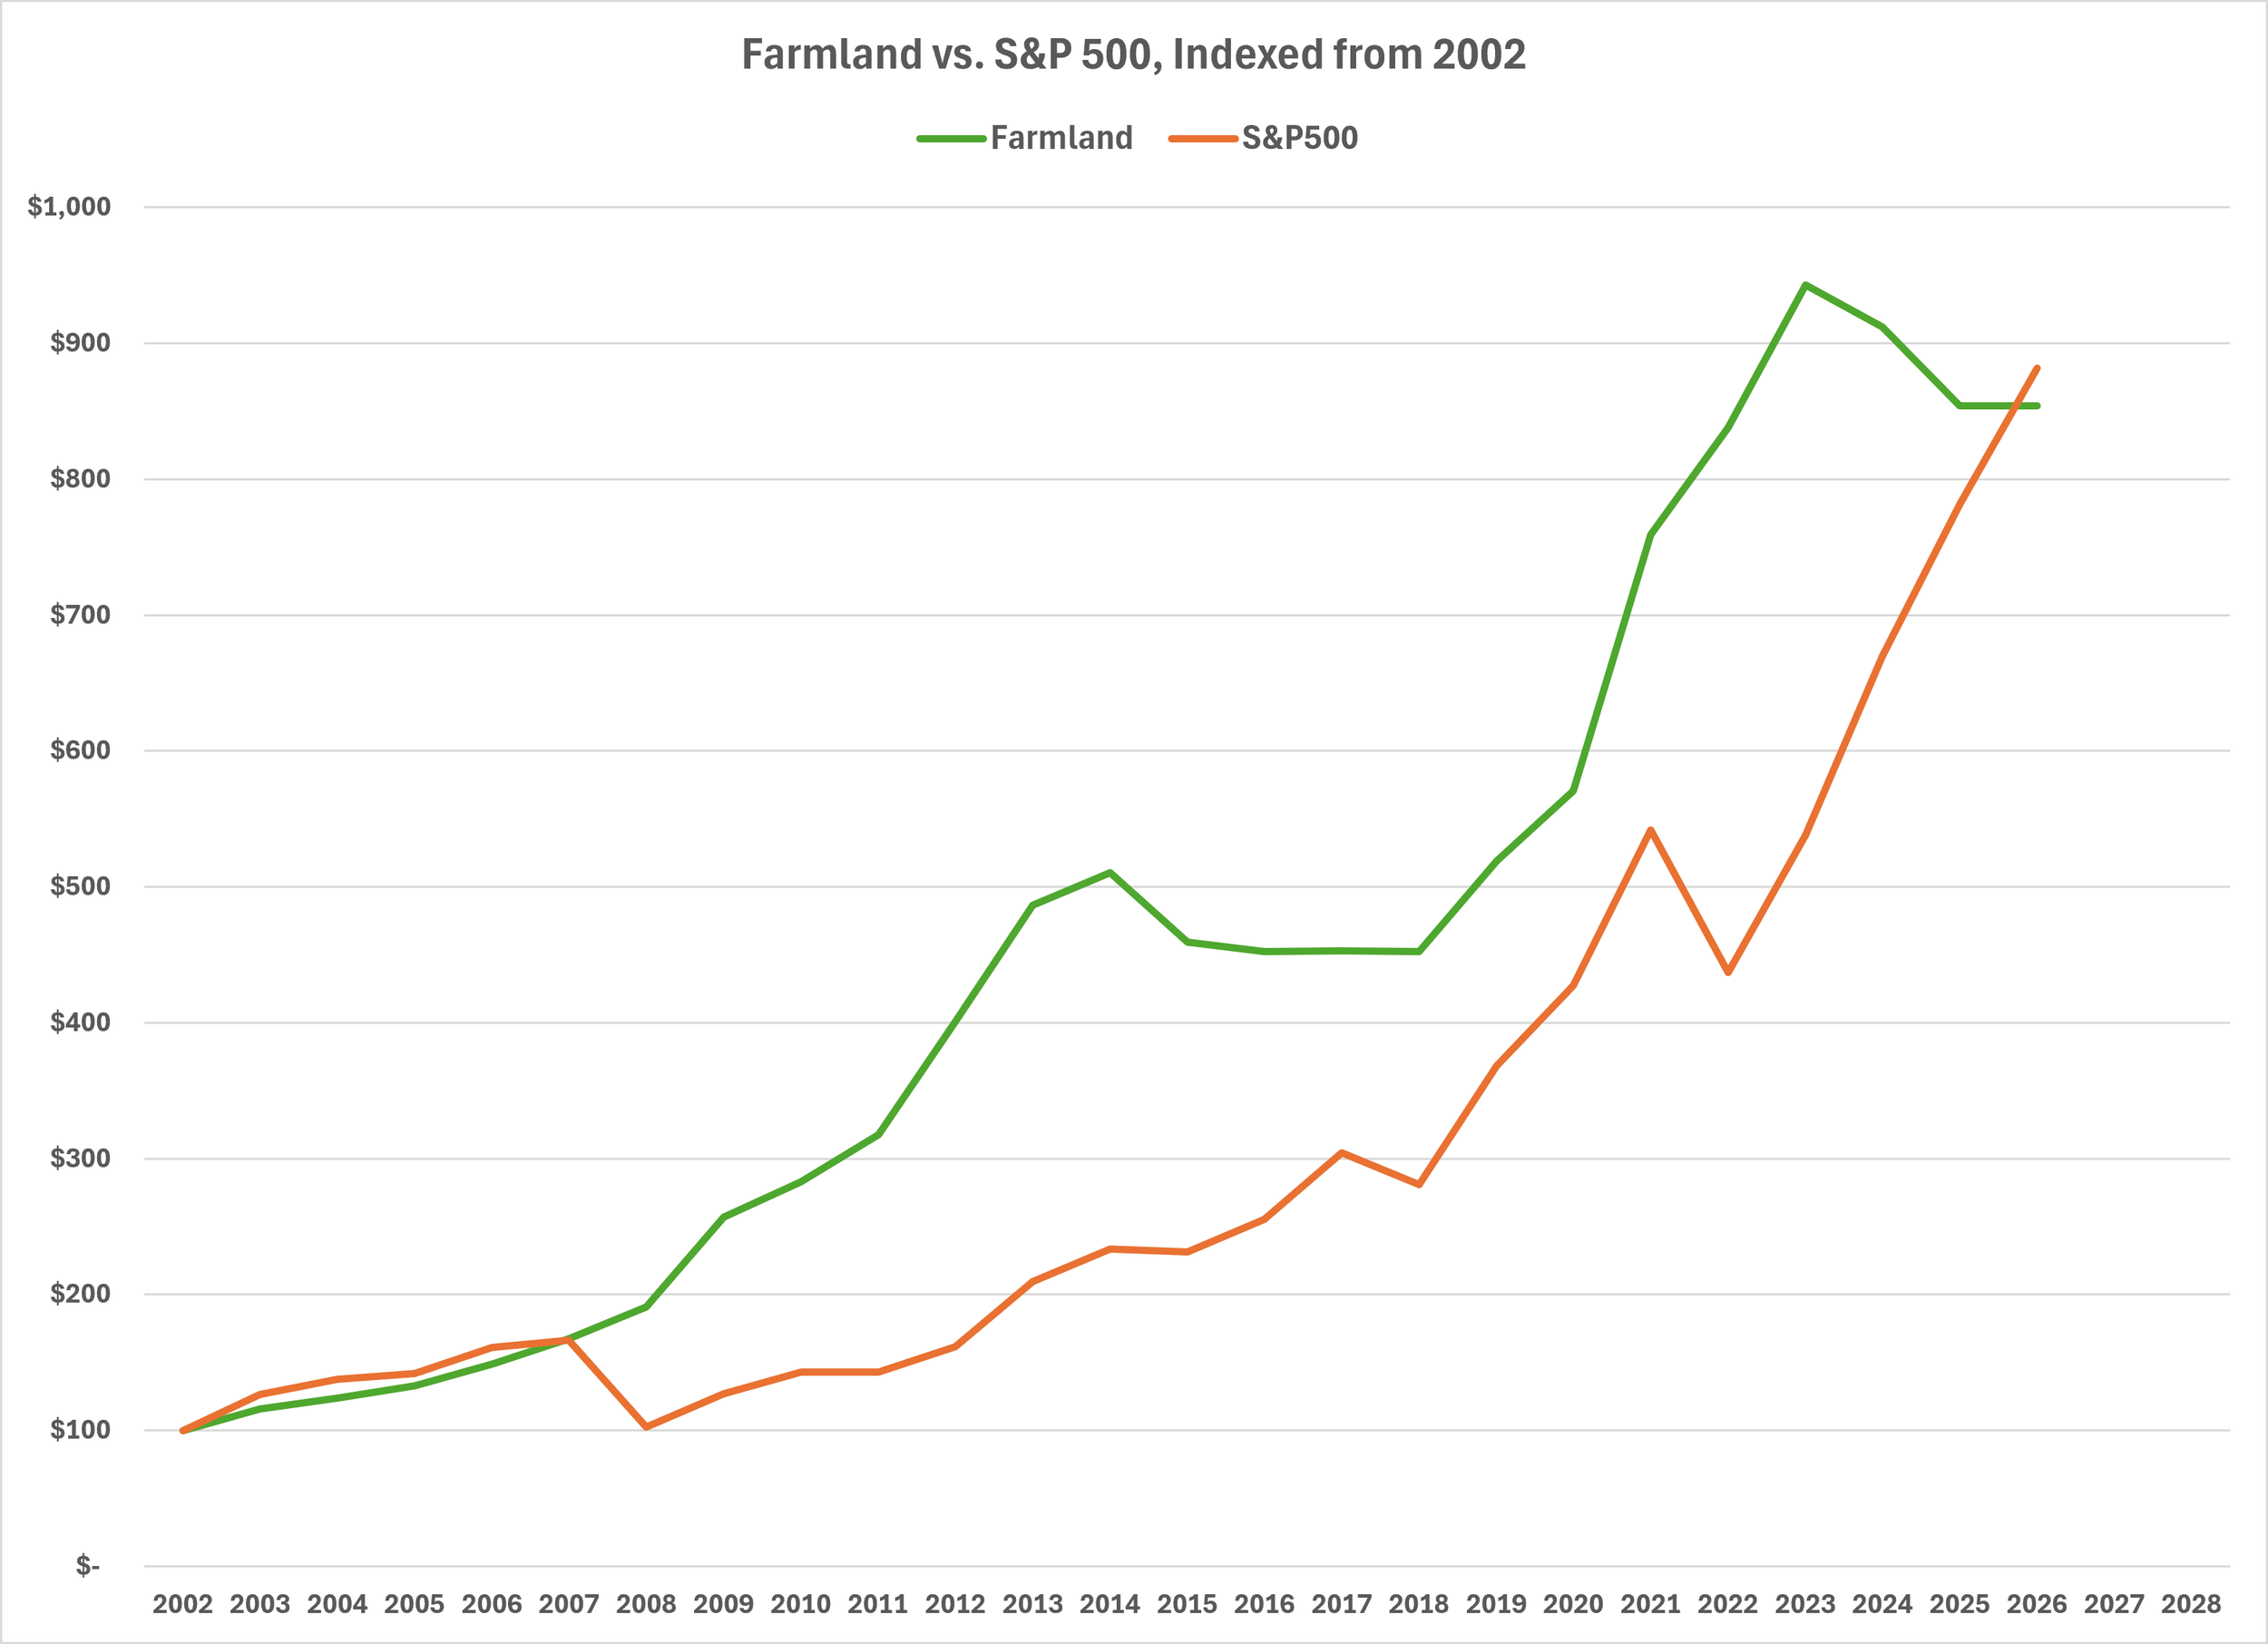
Farmland has exceeded Stocks since 2007.
When indexed to 2002, farm values (“Farmland”) have exceeded the S&P 500 Index (“Stocks”) since 2007. While Stocks have had a number of years with double digit returns, Farmland has exceeded Stocks due to the shallow drawdowns that have occured in Farmland vs. the large drawdowns that have occasionally been experienced in Stocks.
Farmland and Stock Indices are now close.
These indexed values are now relatively close for two reasons:
Stocks have significantly outperformed their average historical returns in recent years.
Farmland has pulled back from highs set two years ago.
Regression to the Trendline.
There are times when prices in any market are over or under their historic trendline. Farmland traded above its trendline a few years ago. Stocks are materially above their trendline now.
In all markets, there is a tendency over time to regress to the trendline.
Data sources and methods:
S&P 500 Index on December 31st of each year as published. 2026 value is value as of 9/21/2026 close.
Farmland values used were the weighted average values per acre of the farmland held by Agribock, L.P. since the fund’s inception in 2002.
Farmland is valued as of December 31st each year by an independent appraiser. 2026 value is 2025 year-end value.
Method of indexing as described in an article published by the Federal Reserve Bank of Dallas: https://www.dallasfed.org/research/basics/indexing